


![]()
![]()
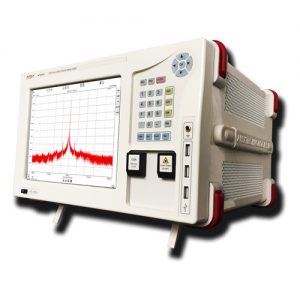
The best resolution compact Optical Spectrum Analyzer ever !
With up to 500 times better resolution than the best standard grating based Optical Spectrum Analyzer on the market, these new generation Optical Spectrum Analyzers can display your signal real spectrum shape and not only its envelope.


Use it as a Wavelength Meter…
The 3 internal Wavelength calibrators (absolute and relative) allow the equipment to provide an excellent wavelength accuracy specification (+/- 2 pm). This high wavelength accuracy gives the possibility to use the equipment as a wavelength meter.
An ultra high dynamic and close-in dynamic range!
APEX Technologies Optical Spectrum Analyzers achieve more than 83 dB of dynamic. They also have the unique advantage to have this high dynamic really close to the peak. For example, when the best standard grating based OSA can achieve 78 dB at +/- 1 nm, APEX Technologies AP2080 series can achieve 80 dB at +/- 6 pm from the peak.


Perfect resolution filters for OSNR measurement !
Several resolution filters between 5 MHz and 250 GHz are available. APEX Technologies rectangular shape resolution filters allow a nearly perfect integration of the signal over the selected resolution, while a grating based Optical Spectrum Analyzer filter integrate inside a wide base triangular shape.
This sharp integration allows our OSA to perform a much more realistic level measurement, essential for an accurate OSNR measurement.
Two Optical Spectrum Analyzers channels, one per polarization axis !
The input signal is split into two orthogonal polarization axes, analysed simultaneously by two internal independent channels, APEX Technologies Optical Spectrum Analyzer has the unique advantage to display the two polarization channels separetely and simultaneously. It can also recombine them and display a polarization independent measurement.


Two Optical Spectrum Analyzers in one equipment!
Optionally, two additional PM inputs directly connected to each internal channels are available. With these 2 additional PM inputs, two independent signals can be analysed simultaneously.
By using this option, the equipment can be used as two Optical Spectrum Analyzers !
Use it as a Tunable Laser Source…
Optionally, the built-in Tunable Laser Source can also be used as an independent Tunable Laser Source. A Tunable Laser Source output and a control software can be integrated into the equipment. This C, L or C+L band Tunable Laser Source is combining narrow linewidth, good SMSR and fine wavelength setting resolution.


Use it as an Optical Spectrum Component Analyzer…
The Tracking generator option allows the user to synchronise the Tunable Laser Source output with the Optical Spectrum Analyzer measurement, thus active and passive components transmission/reflection measurements (insertion loss/gain) are possible with a dynamic range of 63 dB and a resolution of 1 MHz (8 fm). This function is really useful for component analysis as Fibre Brag Grating transfer function characterization.
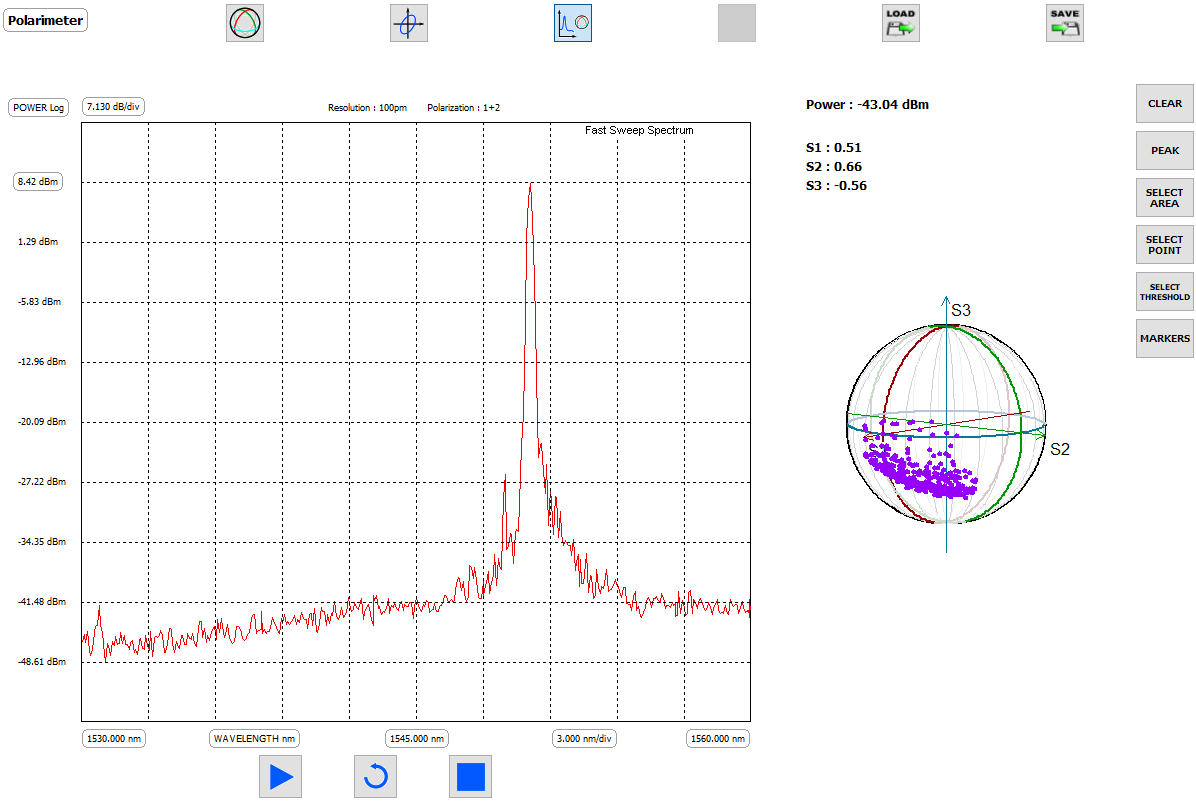
Use it as a Polarimeter…
Optionally, the state of polarization can be measured. This measurement can be integrated over the full wavelength range of the polarimeter or as a function of wavelength. Two different displaying modes exist: Jones graph, Poincaré sphere. Different detection modes are available: peak mode, area mode, point mode, threshold mode, markers mode. The evolution of the state of polarization can be measured as a function of time and as a function of wavelength.
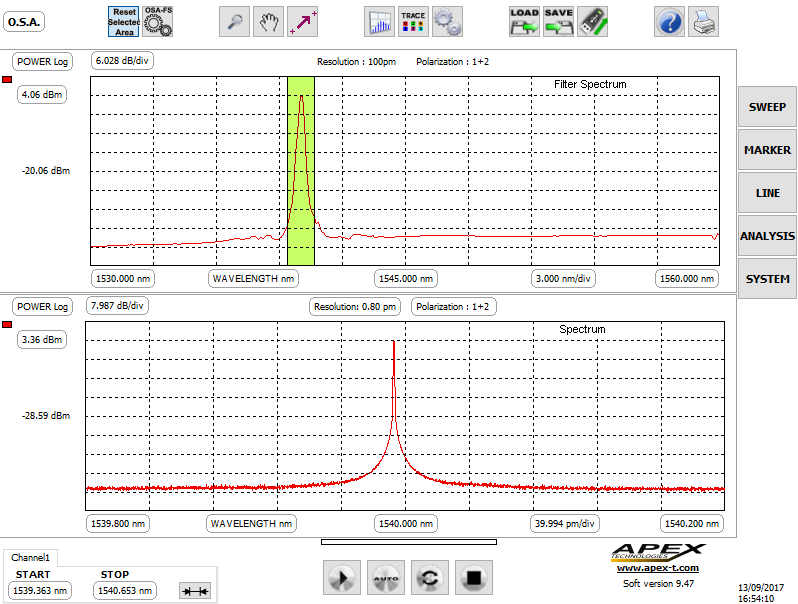
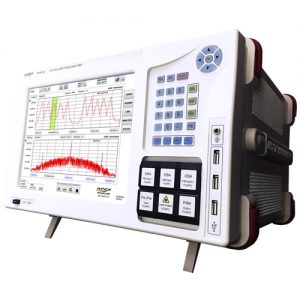
Combination of High resolution and High speed optical spectrum analysis
In order to meet the request of customers, for whom both high resolution and high speed are important, a new option is available for the OSA AP207x series. With this fast sweep option, a grating based OSA is integrated, and keeps scanning the full span with the speed of 70nm/s. By simply choosing an area in the grating OSA graph, the optical spectrum of the selected zone will be displayed with much more details by the High Resolution OSA.
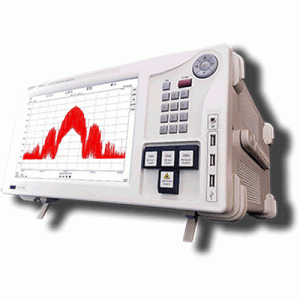
Tunable filter function
The equipment can be used as a 100 pm bandwidth tunable filter in the full C band. This functionality also gives the possibility to filter a chosen part of the input signal to monitor it through two different ways: – with the internal power meters – externally thanks to the filtered signal output
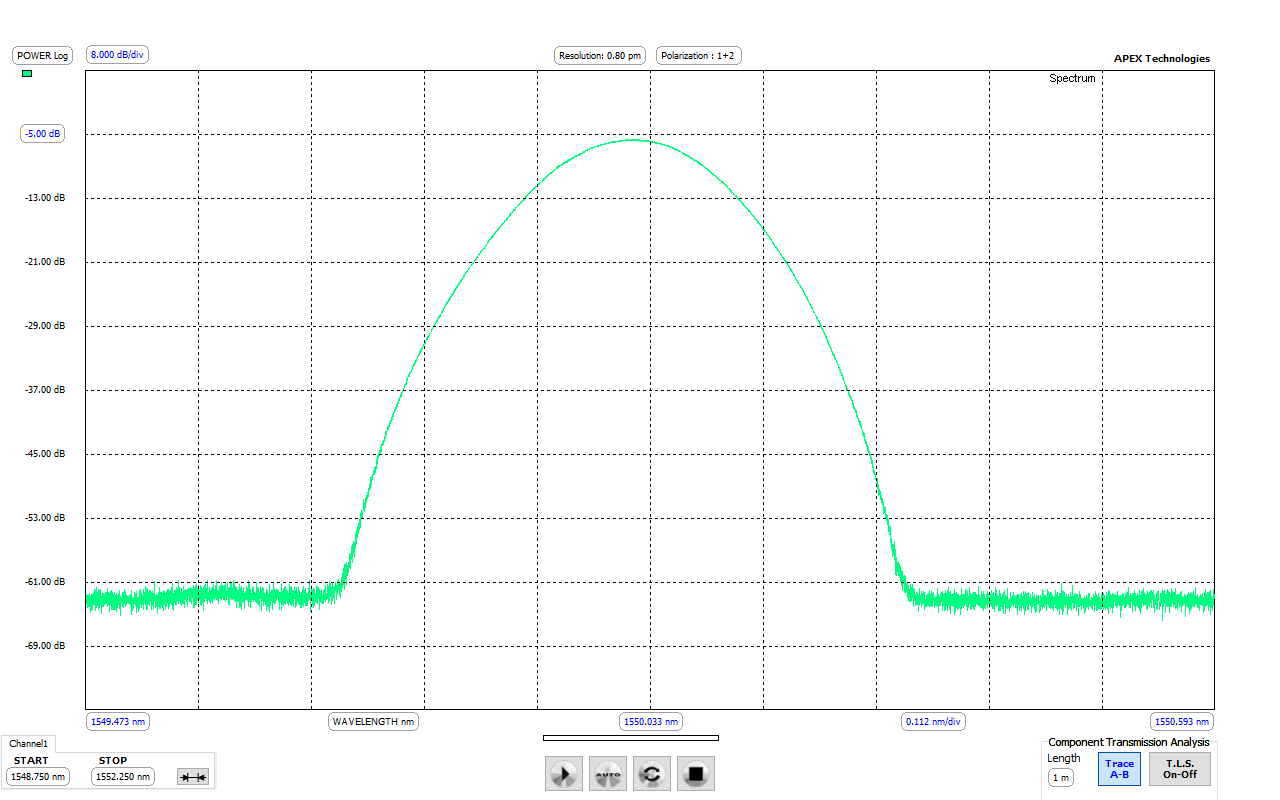
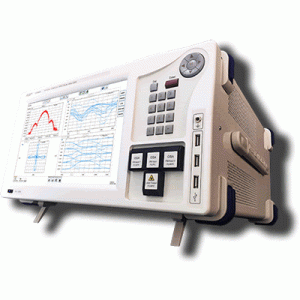
Transfer function in transmission mode of the tunable filter
Choose your OSA
| AP201X Series PM Input Cost Effective |
AP207X Series High Performance |
AP208X Series Top of the line |
AP268X Series Complex Analyzer |
|
 |
 |
 |
 |
 |
| Learn More | Learn More | Learn More | Learn More | Learn More |
Comparaison Table
| AP201x Series | AP206x Series | AP207x Series | AP208x Series | AP268x Series | ||
| Wavelength Range | ||||||
| O Band | X | X | ||||
| C Band | X | X | X | |||
| L Band | X | X | X | |||
| C + L Band | X | X | X | X | X | |
| Extended C + L Band | X | X | ||||
| O + C + L Band | X | X | ||||
| Resolution Bandwidth | ||||||
| Resolution Bandwidth | 5MHz | X | X | X | ||
| 20MHz | X | X | X | X | X | |
| 100MHz | X | X | X | |||
| 140MHz | X | X | X | X | ||
| Virtual Resolution Bandwidth | X | X | X | X | ||
| Input Fibre Type for OSA | ||||||
| SM Input for OSA | X | X | X | X | ||
| PM Input for OSA | X | X | ||||
| Built-in Tunable Laser Source |
||||||
| DFB Laser | X | X | X | |||
| External Cavity Laser | X | X | ||||
| Sweep Speed (Max.) |
||||||
| 1.2nm/s | X | X | X | |||
| 35nm/s | X | X | ||||
| Complexe Measurement |
||||||
| Complexe analysis (Intensity, phase, chirp vs time); Constellation & Eye diagramme | X | |||||
| OPTION | ||||||
| TLS output | X | X | X | X | X | |
| Tracking Generator | X | X | X | X | X | |
| Optical filtered output | X | X | X | |||
| Polarimeter | X | X | X | |||
| SM/PM interface | X | |||||
| 5 MHz Resolution instead of 20 MHz | X | |||||
| Fast sweep OSA (up to 70 nm/s) | X | |||||
| 2 additional PM input | X | X | ||||
| Group delay and Chromatic dispersion analysis | X | |||||
More videos : see Comparison between a grating based and an interferometric Optical Spectrum Analyzer Datasheet | Application Notes | Videos | Request a quotation | Support | Request a Web Demonstration